Hi, I'm trying to create a help/guide section in creatio and I want to include screenshots that I've taken. I can use the label/text component to write out the steps in the guide but I'm not seeing any components that would allow me to display a screenshot.
I am trying to create a chart that shows the sum of all Opportunities closed this year, by Account. I am able to create one that shows the count of all Opps by Account but not sum. When I try to do this via the Account name as the column I do not have that option. If I go to related Objects and choose Account there is also not an option to choose Name. How do I add that field to the available fields in a chart?
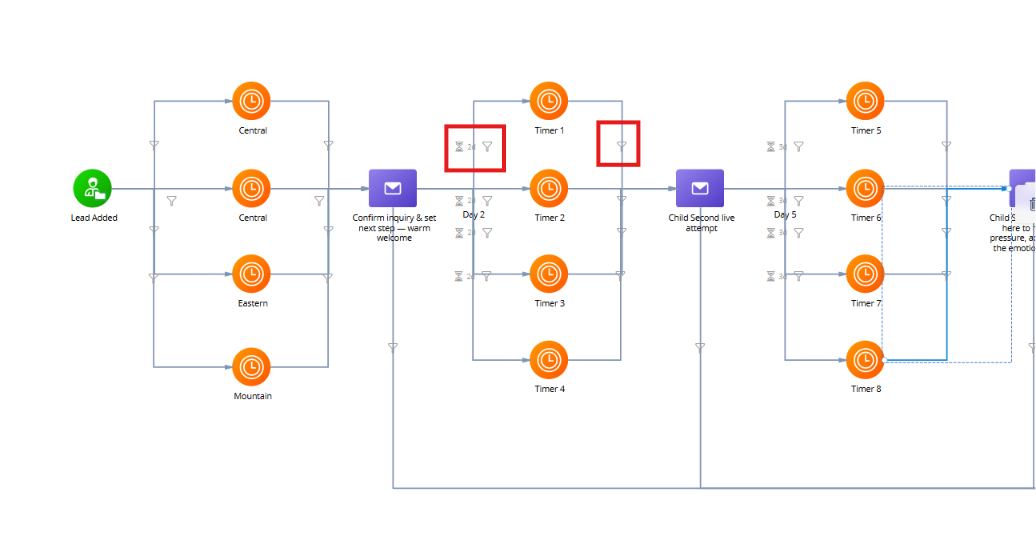
I have created a campaign that sends bulk emails based on different time zones. I just wanted to confirm whether I need to add the same delay time (as shown in the attached screenshot) in the next flow, or will the campaign automatically use the delay that has already been configured in the first flow?
I need to apply relationships between countries, regions, and cities. The clear example is that a user enters a country, and in the next region field, they only see those that correspond to that country, and exactly the same with the cities.
When I add a task, I want it to be visible and editable only by specific roles. However, when I assign a specific role, the role name appears under the task, but users from all roles can still view and edit it.
I also need your support with the following:
How can I make the “Result Details” field inside the task mandatory?
How can I configure the request list so that each user can view only the requests assigned to them or related to their role?