![]()
![]()
Hi Team,
I want to use the below min.js file as a script
https://public.tableau.com/javascripts/api/tableau.embedding.3.latest.min.js
to load the tableau as a IFrame and use the functions of the scriot file add filter to the loaded URL.
To implement it the min.js file has to be included in Creatio. How do we add this file in Creatio?
Regards,
Adharsh S
Like
Hello,
None of this is tested (and I've not used the Tableau embed script to know if it would work this way), but you can try using require for it by adding the following:
requirejs.config({
	paths: {
		Tableau: 'https://public.tableau.com/javascripts/api/tableau.embedding.3.latest.min.js'
	}
});
Note, you can add this before the page code define and then include as a reference for it:
define("UsrMyCustomObject1Page", ["Tableau"], function (Tableau) {Then use as something like:
const viz = new Tableau.TableauViz();
viz.src = 'https://my-server/views/my-workbook/my-view';
viz.toolbar = 'hidden';
document.getElementById('tableauVizElement').appendChild(viz);
Ryan
Hi Adharsh
You can use this addon to add JS scripts globally: https://marketplace.creatio.com/app/experceo-global-jscss-editor-creatio
Go to System Settings -> ExpGlobalJSValue to update the global JavaScript script.
require(["https://public.tableau.com/javascripts/api/tableau.embedding.3.latest.min.js], function(lib) {
window.Tableau = lib;
});
Then you can use window.Tableau in your js code.
Hope this helps!
Ryan Farley,
Hi, It is not working for me
(Option-1): Adding External JS in main file
requirejs.config({
  paths: {
   Chart:'https://cdnjs.cloudflare.com/ajax/libs/Chart.js/4.5.0/chart.min.js'
  }
});

define("Accounts_FormPage", ["Chart"], function/**SCHEMA_ARGS*/(Chart)/**SCHEMA_ARGS*/ {
// code
});
Error: Uncaught Error: Script error for "Chart", needed by: Accounts_FormPage
(Option-2): Creating new module file & import it in main file
File: UsrChartLib
requirejs.config({
	paths: {
		Chart: 'https://cdnjs.cloudflare.com/ajax/libs/Chart.js/4.5.0/chart.min.js'
	}
});
File: Accounts_FormPage
define("Accounts_FormPage", ["UsrChartLib"], function/**SCHEMA_ARGS*/(Chart)/**SCHEMA_ARGS*/ {
return {
viewConfigDiff: /**SCHEMA_VIEW_CONFIG_DIFF*/[]/**SCHEMA_VIEW_CONFIG_DIFF*/,
viewModelConfigDiff: /**SCHEMA_VIEW_MODEL_CONFIG_DIFF*/[]/**SCHEMA_VIEW_MODEL_CONFIG_DIFF*/,
modelConfigDiff: /**SCHEMA_MODEL_CONFIG_DIFF*/[]/**SCHEMA_MODEL_CONFIG_DIFF*/,
handlers: /**SCHEMA_HANDLERS*/[
	{
		request: "usr.GenerateContactChartRequest",
		handler: async (request, next) =>
		{

			try {
				// 1. Fetch Context Data
				console.log("Generate Charts Button Clicked");

				const contactId = await request.$context.Id;
				console.log("Contact: ",contactId);

				if (!contactId) {
					console.error("No Contact ID found. Cannot generate charts.");
					return next.handle(request);
				}

				// --- 2. Define Data Variables (Fetch from Page Context) ---
				// Replace 'PDS_UsrInPerson_...' with your actual attribute codes
				const isPersonValue = await request.$context.PDS_UsrInPerson_64gzj70 ? 100 : 20;

				// FIX: Defined consentValue which was missing in your snippet
				const consentValue = await request.$context.PDS_UsrDataProtectionConsent_urep1g6 ? 80 : 30;


				// --- 3. Define Helper Functions ---

				// A. Chart Generation Helper
				const createChartImage = async (type, data, options = {}) => {
				return new Promise((resolve) => {
					const canvas = document.createElement('canvas');
					canvas.width = 600;
					canvas.height = 400;
					const ctx = canvas.getContext('2d');

				// 3. Initialize using the extracted class
				new Chart(ctx, {
					type: type,
					data: data,
					options: {
						animation: false,
						responsive: false,
						...options
					}
				});

					// Resolve the promise with the Base64 string
					const base64String = canvas.toDataURL("image/png");
					resolve(base64String);
				});
				};

				// B. Database Save Helper
				const saveChartSnapshot = async (ContactId, ChartType, ImgStr) => {
				return new Promise((resolve) => {
					// Check if modern Model API is available (Freedom UI Best Practice)
					if (request.$context && request.$context.getModel) {
						const runSave = async () => {
							const model = await request.$context.getModel("UsrChartSnapshot");
							await model.insert({
								UsrContact: { value: ContactId },
								UsrChartType: ChartType,
								UsrImageData: ImgStr
							});
							resolve();
						};
						runSave();
					} else {
						// Fallback to Classic ExtJS API
						var insert = Ext.create("Terrasoft.InsertQuery", { rootSchemaName: "UsrChartSnapshot" });
						insert.setParameterValue("UsrContact", ContactId, Terrasoft.DataValueType.GUID);
						insert.setParameterValue("UsrChartType", ChartType, Terrasoft.DataValueType.TEXT);
						insert.setParameterValue("UsrImageData", ImgStr, Terrasoft.DataValueType.TEXT);
						insert.execute(() => resolve());
					}
				});
				};

				// --- 4. Execute Chart Generation ---

				// A. Generate and Save Pie Chart
				const pieBase64 = await createChartImage('pie', {
					labels: ['In Person', 'Remote'],
					datasets: [{
						data: [isPersonValue, 100 - isPersonValue],
						backgroundColor: ['#36a2eb', '#ff6384']
					}]
				});
				await saveChartSnapshot(contactId, "Pie", pieBase64);
				console.log("'Pie Chart' saved.");

				// Optional: Refresh the page data so the new charts appear in lists immediately
				// request.$context.executeRequest({ type: "crt.LoadDataRequest" });

			}
			catch (error)
			{
			console.error("Error generating or saving charts:", error);
			}

			return next.handle(request);
	}
	}
]/**SCHEMA_HANDLERS*/,
converters: /**SCHEMA_CONVERTERS*/{}/**SCHEMA_CONVERTERS*/,
validators: /**SCHEMA_VALIDATORS*/{}/**SCHEMA_VALIDATORS*/
};
});
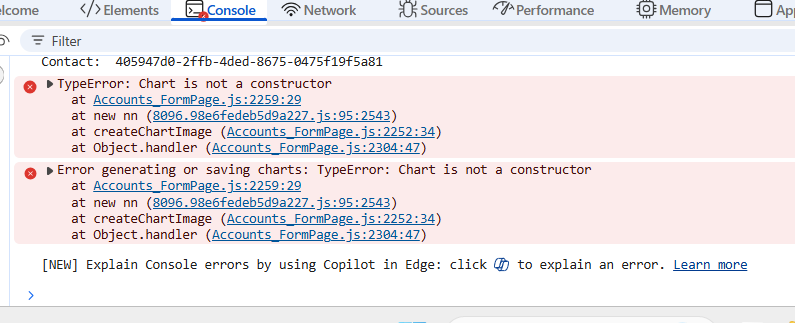
Error: