


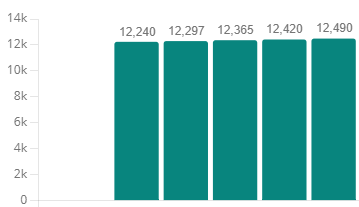
Is there a way to set the axis values, or add a minimum value when making graphs? Similar to how you can in Microsoft Excel. I have this chart and the values are all similar, so I'd like to have the axis start at 10k to better emphasize the difference.
Like
0 comments