![]()
![]()
I have a query regarding reporting functionality in Creatio.
Could you please help clarify how we can configure custom visualization charts using data from a Creatio object and include these charts in a printable report?
I have noticed that printable reports can be generated in Word format. I would like to understand whether there is a way to configure these reports to be generated in a personalized PDF format, particularly when they include custom charts or visual elements.
Any guidance on the supported configuration options would be greatly appreciated.
Like
Greetings,
Creatio report designer for Word printables does not yet support embedding dynamic charts generated from Creatio object data.
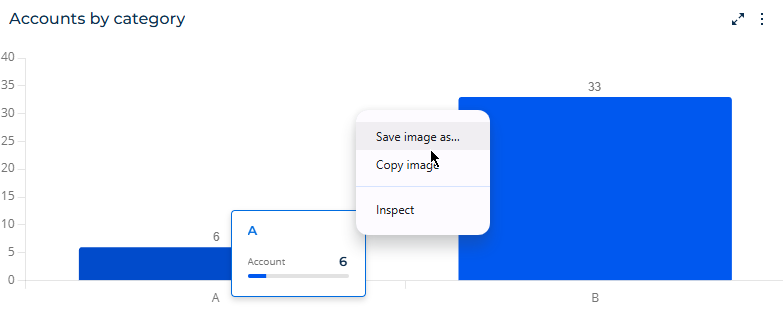
However, you can export chart and dashboard data to Excel to process data more easily. To do this, expand the dashboard and select Export to Excel in the context menu. The browser will download the data file. Also, you can save a dashboard as a .png image to your computer by clicking the right button of your mouse:
You can find more information here: https://academy.creatio.com/docs/8.x/resources/release-notes/803-atlas-release-notes#title-3964-8
Also, to generate reports in PDF format, you can use the following marketplace add-on: https://marketplace.creatio.com/app/asposepdf-connector-creatio
Please let us know if you have other questions.
Thank you for reaching out!